
Call for sugar - sweetened soft drink manufacturers to set global sugar reduction targets to help halt worldwide obesity epidemic set to reach 1.12 billion by 2030
Embargoed until 00.01 on 1st October 2015
• 88% of sugar-sweetened soft drink products contain more than your entire recommendation for the day (25g) [1] in a 330ml can
• Sprite in Thailand contains the highest amount of free sugars - a staggering 12 tsp of sugar in a single can [2]
• UK manufacturers still producing drinks high in free sugars despite being one of the countries in Europe where obesity, type 2 diabetes and tooth decay are high
• Leading supermarkets in the UK prefer to follow set sugar reduction targets – branded companies must now do the same
For the data International Drinks Data [PDF 255KB]
For media coverage: Soft drinks survey - media coverage
NEW research by Action on Sugar has revealed the shockingly high and unnecessary levels of free sugars [3] found globally in sugar-sweetened soft drinks [4] and is now calling for ALL international drink manufacturers to unite in setting sugar reduction targets immediately.
Sugar-sweetened soft drinks are linked to the escalating worldwide obesity and type 2 diabetes epidemic. Figures show that by 2030, an estimated 2.16 billion people will be overweight – of these, 1.12 billion individuals will be obese [5].
The survey, which reviewed 274 sugar-sweetened soft drinks produced across the world, found that every single product (with available nutrition data) would receive a dangerously high red colour-coded label if it were consumed in a standard 330ml can [6]. Furthermore, 88% of products (with available nutrition data) contain more than your entire recommendation for the day [7]. Indeed if a 330ml can of Coca Cola, Pepsi and 7Up were consumed anywhere in the world, 100% contain more than an entire adult’s maximum daily amount of free sugars for the day (25g – 6 tsp/d).
In four out of seven cases, the countries with the highest free sugars content per 330ml were in North America (either Canada or the USA), compared to countries in Europe which had the lowest sugar content.
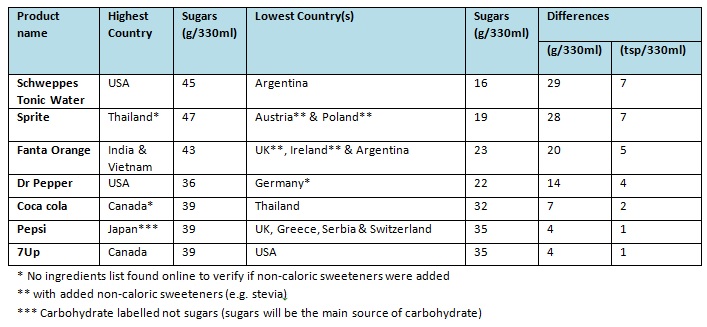
The greatest variation between countries was in Schweppes Tonic Water with a variation of 29g (7 tsp) of sugars between the country (USA) - which produced the most sugary variety of Schweppes Tonic Water – and the country (Argentina) which produced the lowest. Sprite also had a high variation of 28g (7 tsp).
Interestingly the sugar-sweetened soft drink products produced by PepsiCo [8] generally had less nutritional information available online (on average) for consumer reference (i.e. 37% of the products surveyed) which adds to further concern about transparency when it comes to labelling.
Table 1: Difference in highest and lowest free sugars content of popular sugar-sweetened soft drink
United Kingdom
In five out of seven iconic products, interestingly it is NOT UK manufacturers who produce the least sugary drinks (Table 2). Coca Cola in Thailand contains 3g LESS free sugars than in the UK (over half a teaspoon in a can).
The results clearly show that sugar-sweetened soft drinks can be easily reformulated in the same way as the very successful salt reduction programme in the UK. Action on Sugar has written to all the leading supermarkets who led the initial work on salt reduction and all have agreed to reformulate their sugar-sweetened soft drinks according to their own programme. What’s more, the majority will reformulate in a more coherent way with reduction targets for each soft drink category overseen by an independent agency, without the addition of artificial sweeteners and a parallel reduction in sweetness of all soft drinks [9]. This would result in a large reduction in the free sugars and calorie intake in the UK. Action on Sugar is now calling on the UK government to lead the world by implementing this programme IMMEDIATELY.
Table 2: Comparison between countries with less free sugars than the UK

Graham MacGregor, Professor of Cardiovascular Medicine at Queen Mary University of London and Chairman of Action on Sugar, says: “Overweight and obesity increases health-care costs and threatens the economic growth on which a country’s future prosperity and wellbeing depend. This survey illustrates the fact that the soft drinks industry is part of the cause of the world’s growing obesity pandemic and action must be taken now.
“In the UK, all leading supermarkets are either reducing sugars in their soft drinks or have committed to follow sugar reduction targets. Jeremy Hunt has not taken any action for over a year; it’s time David Cameron took the lead on this.”
Kawther Hashem, nutritionist at Action on Sugar says: “It’s high time soft drinks manufacturers around the world stop adding unnecessary sugars and calories to their products and work universally to set sugar reduction targets once and for all. Our research has shown discrepancies between the sugar content in the same carbonated drinks sold across the world and this needs to stop.
“People are drinking spoonful’s of sugar in their carbonated drinks. Look on the label for ‘sugars per 100ml’ and switch to a lower or no added sugar variety of your favourite drink, or even better, don’t drink them, they contain nothing of any nutritional value. Drink water and save money too!”
Aubrey Sheiham, Emeritus Professor of Dental Public Health at University College London, says: “Tooth decay is the most common cause of pain, especially in children and the main reason why they are admitted to hospital in England. The worldwide epidemic of tooth decay will only be controlled when manufacturers markedly reduce the levels of sugars in their products.”
Simon Capewell, Professor of Clinical Epidemiology at the University of Liverpool, says: "Reducing the sugars hidden in soft drinks is easy; witness the successful reductions in UK own brands. It is now time for ALL sugary drinks manufacturers to do the same, and thus put their customers health first."
Professor David Haslam, Chair at National Obesity Forum, says: "The food and drink industry has created a monster; a small can of soft drink that contains around 10 times the quantity of sugar than a person's blood stream holds. There are no redeeming features of these drinks: metabolic disturbances, tooth decay and manic kids are amongst the side effects, alongside no nutritional benefit."
Special thank you to Charlotte Keller, 3rd year Medical student, University College London, for working on the survey.
-Ends-
For more information contact:
National PR – David Clarke @ Rock PR
E: david@rock-pr.com M: 07773 225516
Website http://www.actiononsugar.org/
Tweet https://twitter.com/actiononsugar #LessSugar
Notes to Editors
1. A new WHO guideline recommends adults and children reduce their daily intake of free sugars to below 5% of their total energy intake or roughly 25 grams (6 teaspoons) per day would provide additional health benefits. This would be lower for young children. http://www.who.int/mediacentre/news/releases/2015/sugar-guideline/en/
2. A standard sugar-sweetened soft drink single can sold in the UK contains 330ml
3. Free sugars – includes sugars that are added to food and drink, as well as sugars that are naturally present in honey, syrups, fruit juices and fruit juice concentrates, not sugars in milk products and whole fruit & vegetables.
4. Survey details - full survey sorted by highest sugars per 100g
• Sugars per 100ml information was collected from Coca Cola, Sprite, Schweppes tonic water, Fanta orange, Dr Pepper, Pepsi and 7Up in store or online from June 2015.
• Data table sorted by brand, alphabetically, highest sugars per 330ml in 2015.
• Products translated from native language to English.
• Criteria for selection:
- must operate within at least 3 regions (for ease of analysis/accessibility of information)
- must have at least one widely consumed product
- must have at least one product/product equivalent that is comparable across countries
- must have nutritional information available on website
• 274 products in total were surveyed.
• 127 products did not provide nutritional information online and we could not obtain product packaging from the country.
• 26 products out of the 147 with available nutrition data, did not provide ingredients list online and we could not obtain product packaging from the country.
5. Kelly T, Yang W, Chen CS, et al. Global burden of obesity in 2005 and projections to 2030. International journal of obesity 2008;32(9):1431-37 doi: Doi 10.1038/Ijo.2008.102.
6. Colour coded labels are given per 330ml. Portion size criteria applies to portion/serving sizes greater than 150ml. Colour coded labelling given per portion for drinks based on new front of pack Colour Coded Labelling criteria.
Sugar - Red >13.5g/portion or >11.25g/100ml Amber >2.5≤11.25g/100ml, Green ≤2.25g/100ml - https://www.gov.uk/government/uploads/system/uploads/attachment_data/file/207588/FINAL_VERSION_OF_THE_2013_FOP_GUIDANCE_-_WEB.pdf#sthash.tIzxHErf.dpuf
7. A new WHO guideline recommends adults and children reduce their daily intake of free sugars to less than 10% of their total energy intake. A further reduction to below 5% or roughly 25 grams (6 teaspoons) per day would provide additional health benefits. http://www.who.int/mediacentre/news/releases/2015/sugar-guideline/en/
8. PepsiCo produce Pepsi and 7Up
9. ASDA, Morrisons, Sainsbury’s and Tesco would take part in a more coherent programme with reduction targets for each soft drink category.
